Here's a scenario we see more often than we'd like: a Liferay site that flies in staging falls apart the moment real traffic shows up. No stack traces, CPU looks fine, the database isn't pegged, and yet pages just... hang. People start refreshing. Support tickets roll in. Someone suggests adding another server.
Nine times out of ten, the extra server won't help, because the bottleneck isn't compute. It's the connection pool. So before you throw hardware at the problem, it's worth understanding what's actually happening between Liferay and your database.
Why a database connection is expensive
Liferay talks to the database constantly, on nearly every request. A login, a page render, a search, a workflow step, a scheduled job: all of it needs a JDBC connection at some point.
The catch is that opening a connection isn't cheap. There's a TCP handshake, authentication, and session setup on the database side. Do that once and you'll never notice it. Do it on every single request, thousands of times a minute, and you're paying a tax that quietly eats your response times until the whole thing tips over under load.
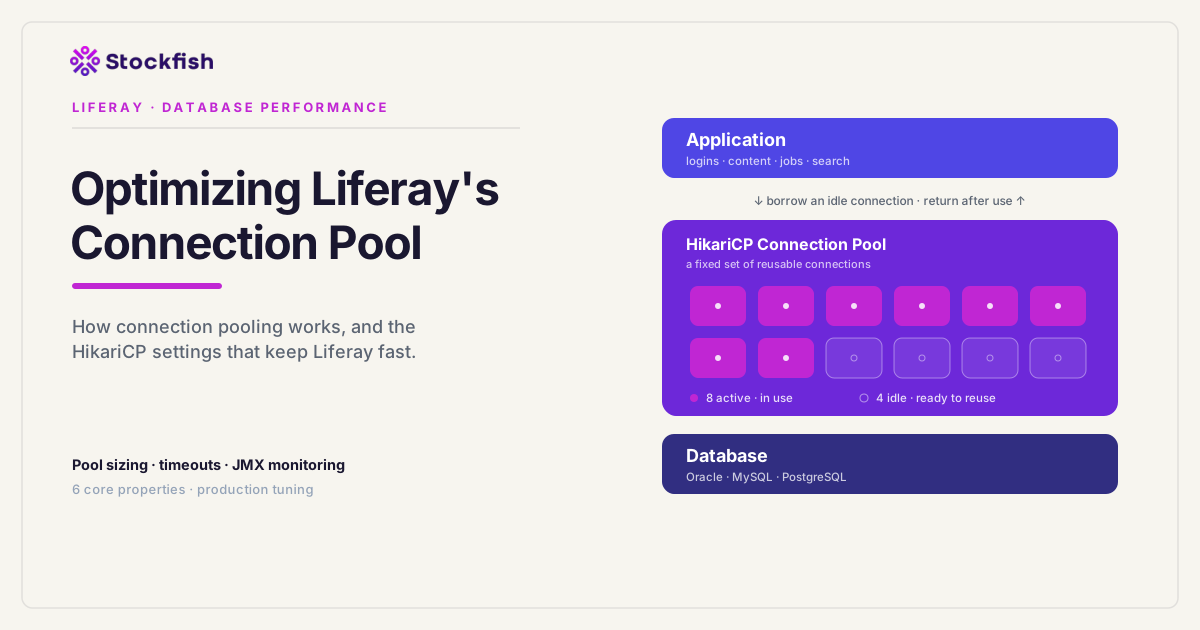
That's the entire reason connection pools exist. Instead of opening and closing a connection each time, you keep a small set of them open and hand them out on demand. A request borrows one, runs its query, and returns it. The expensive part (creating the connection) happens up front, at startup, not on the hot path where users are waiting.
Why Liferay ships with HikariCP
Recent versions of Liferay DXP use HikariCP as the default pool, and honestly, it's a good default. HikariCP is small, fast, and boring in the best possible way. It stays out of your way and doesn't add surprises. Low acquisition latency, solid behavior under concurrency, and JMX metrics baked in so you can actually see what the pool is doing.
You configure it in portal-ext.properties. Out of the box, Liferay hands you something close to this:
jdbc.default.connectionTimeout=30000
jdbc.default.idleTimeout=600000
jdbc.default.maximumPoolSize=180
jdbc.default.minimumIdle=10
jdbc.default.maxLifetime=0
jdbc.default.registerMbeans=true
jdbc.default.transactionIsolation=2
Read those as a starting point, not a recommendation. I'll repeat that, because it's the single most common misunderstanding I run into: these are defaults, not targets. And maximumPoolSize=180 in particular is a number I've almost never left as-is.
The settings that actually matter
HikariCP has a lot of knobs. Most of them you'll never touch. Here are the handful that earn their keep, and what I actually do with each one.
connectionTimeout: fail fast
jdbc.default.connectionTimeout=30000This is how long a thread waits for a free connection before it gives up. The default is 30 seconds. In practice, that means a request stuck waiting for the pool will hang for half a minute before it finally errors, which is more than enough time for a user to refresh three times and open a ticket.
For anything user-facing, I usually pull this down to 5 or 10 seconds. If the pool is exhausted, I'd rather a request fail quickly and loudly than sit there pretending everything's fine. A fast failure is a signal. A 30-second hang is just suffering.
maximumPoolSize: smaller than you think
jdbc.default.maximumPoolSize=180This is the one people get wrong, and they almost always get it wrong in the same direction: bigger must be faster, right? So they bump it up, the problem doesn't go away, they bump it up again.
Here's the uncomfortable part. A bigger pool is frequently slower. Every connection is a live session on the database, chewing memory and competing for CPU and locks. Picture 180 connections per node across a three-node cluster: that's 540 sessions all elbowing each other on a single database. At that point you're not scaling, you're creating contention.
The right number depends on your database's capacity, your CPU cores, how long your queries actually take, how many nodes you're running, and whatever else shares that database. There's no magic value, but the honest starting point for most Liferay deployments is far below 180. Whatever you land on, prove it with load testing rather than a hunch.
minimumIdle: how many to keep warm
jdbc.default.minimumIdle=10The floor of idle connections kept ready so you're not creating one from scratch the instant traffic arrives. Small sites don't need many. Busier ones benefit from keeping a few extra warm to smooth out spikes. Set it too high, though, and you're just holding database sessions and memory hostage for connections nobody's using. A common, sane move is to keep minimumIdle equal to maximumPoolSize so the pool is a fixed size: no churn, predictable behavior.
idleTimeout: reclaiming the extras
jdbc.default.idleTimeout=600000Ten minutes by default. If you're running a variable-size pool, this controls how long a spare connection lingers before HikariCP trims it, and it only trims once you're above minimumIdle. Shorter reclaims database resources sooner. Longer avoids re-creating connections during on-and-off traffic. If your pool is fixed (idle equal to max), this one stops mattering.
maxLifetime: the one that saves you at 3am
jdbc.default.maxLifetime=0A value of 0 means connections never retire on age. That's fine in a vacuum, but real environments aren't a vacuum. Databases and firewalls love to quietly kill connections that have been open "too long," and a pooled connection that the database has already dropped is a landmine: it looks alive until someone tries to use it, then blows up mid-request.
The fix is simple. Set maxLifetime a little shorter than whatever timeout your database or network enforces, so HikariCP retires and rebuilds connections on its own terms, before the database yanks them out from under you. This is the setting that quietly prevents a whole category of intermittent, impossible-to-reproduce errors.
registerMbeans: turn the lights on
jdbc.default.registerMbeans=trueThis exposes the pool over JMX. Leave it on in production. Flying blind on connection pool behavior is how a small problem becomes a 2am incident. With this enabled you can watch active connections, idle count, total, and the one that matters most: how many threads are stuck waiting for a connection.
transactionIsolation: leave it alone
jdbc.default.transactionIsolation=2That's READ_COMMITTED, which keeps you from reading another transaction's uncommitted changes. It's the right level for basically every enterprise Liferay app. Unless you have a very specific, well-understood reason to change it, don't.
Sizing a real cluster
Abstract advice only goes so far, so let's do the arithmetic on a setup we see all the time: three Liferay nodes, one shared Oracle database, and a DBA who's given you a hard ceiling of 200 total connections.
The instinct is to divide 200 by 3 and call it a day. Don't. First, carve out a buffer. Reserve roughly 20 connections for monitoring agents, admin sessions, backups, and anything else that touches that database. That leaves about 180 to split across the application nodes:
jdbc.default.maximumPoolSize=60
jdbc.default.minimumIdle=15
Sixty per node, three nodes, and you're comfortably under the ceiling with headroom to spare. No single node can exhaust the database, connections are spread evenly, the DBA still has room to work, and you're not living one traffic spike away from a connection-refused error. It's not glamorous math, but it's the difference between a cluster that holds up and one that falls over on your busiest day.
What to actually watch in production
Once JMX is on, most of the metrics are context. The one to keep your eyes on is Threads Awaiting Connection, the count of requests queued up waiting for a connection to free up. When that number climbs and stays up, your pool is a bottleneck.
But here's the trap, and it's a big one: a rising wait count does not automatically mean "increase the pool size." Nine times out of ten it means connections are being held too long, and that points somewhere else entirely: a slow query, a missing index, a transaction that stays open longer than it should, or a plain old connection leak where some code borrowed a connection and never gave it back.
Bumping the pool size in that situation just hands more connections to code that's already hoarding them. You've hidden the symptom and made the eventual failure bigger. Find out why connections aren't coming back before you touch the pool. Connection tuning can't rescue a bad query. It'll only paper over it for a while.
The short version
If you take one thing away, make it this: tuning HikariCP is not about turning the numbers up. It's about matching the pool to what your database can actually handle, watching the right metric, and fixing the slow queries and leaks underneath instead of drowning them in connections.
The defaults will carry a small site just fine. But the moment you're running a cluster with real traffic, a few deliberate values (a tighter timeout, a sane pool size, a maxLifetime that respects your database) are what keep the site quick and steady when it counts. Get those right and the connection pool becomes the thing you never have to think about again. Which, honestly, is the whole point.